skip to navigation

|
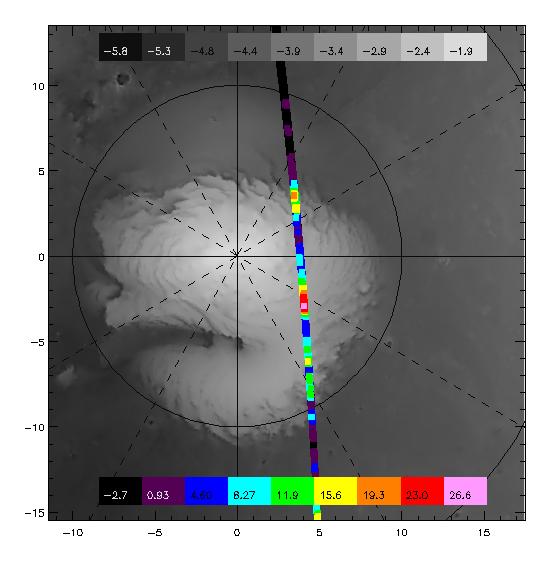
TES overlayed on MOLA DEM
- Click the image above for a larger view
- Full-Res JPEG (551 x 561) (34.9 kB)
- Full-Res TIFF (551 x 561) (119.9 kB)
Caption:
This image is TES thermal data (Orbit 222) overlayed on the MOLA DEM. The color scale is TES T18-T25, which is a cold spot index. The grey scale is MOLA elevation in kilometers. Most cold spots can be attributed to surface spectral emissivity effects. Regions that are colored black-violet-blue have near unity emissivity and are coarse grained CO 2 . Regions that are yellow-red are fined grained CO 2 . The red-white spot located approximately 300W85N is our most likely candidate for a CO 2 snow storm.
Cataloging Keywords:
| Name | Value | Additional Values |
|---|---|---|
| Target | Mars | |
| System | ||
| Target Type | Planet | |
| Mission | Mars Global Surveyor (MGS) | |
| Instrument Host | Mars Global Surveyor | |
| Host Type | Orbiter | |
| Instrument | Thermal Emission Spectrometer (TES) | |
| Detector | ||
| Extra Keywords | Atmosphere, Color, Storm, Thermal | |
| Acquisition Date | ||
| Release Date | 1999-08-17 | |
| Date in Caption | ||
| Image Credit | NASA/JPL/ASU | |
| Source | photojournal.jpl.nasa.gov/catalog/PIA02307 | |
| Identifier | PIA02307 | |